


Skin Friction database simplifies antifouling cost/benefit analysis
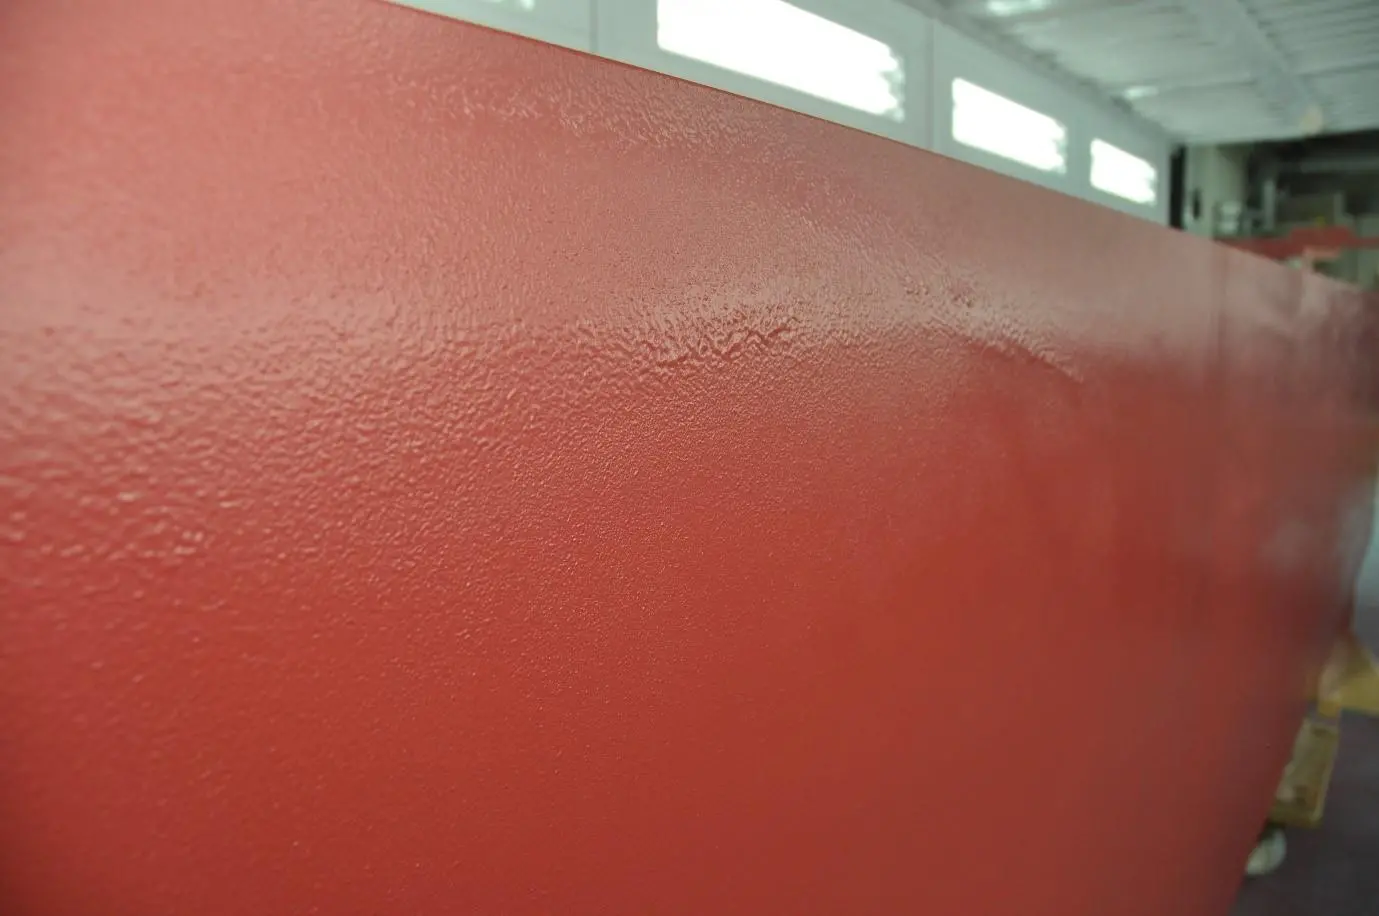
Decisions about which coating to use or how often the surfaces should be recoated or cleaned rely on detailed cost/benefit analyses. But the difficulty of modelling the effects of fouling on fuel consumption has meant ship operators and owners have not always factored this into cost/benefit analyses of the additional opex cost of more frequent surface maintenance.
To help to address this gap in easily accessible information for shipowners and operators, Sweden’s SSPA, towing tank and maritime solutions company, has developed a publicly accessible tool in collaboration with hull coatings and paint supplier Jotun. The tool was a product of an SSPA research project into the effects of fouling on skin friction, funded by the Swedish Energy agency and Region Västra Götaland.
The solution includes an interactive tool, or Skin Friction database, that can be used to estimate fuel consumption without requiring background knowledge in hydrodynamics. SSPA hopes the database will make it easier for shipowners and operators to produce cost/benefit analyses around planning surface treatment of vessels, as it reduces costs and emission of greenhouse gases from the maritime sector.
Skin Friction database
Existing published measurements that link surface roughness to skin friction are incomplete and do not cover all (or most) of the possible surface topologies seen on vessels. One of the goals of the Skin Friction database is to increase the knowledge of rough surface effect on skin friction. The database consists of three elements: Model tests of rough surfaces, extrapolation to full scale vessel length and speed and the database interface including a fuel consumption tool.
The database interface is interactive and consists of the following sections; vessel information, which requires only a minimum amount of information to allow for easy use, and graphs of skin friction in model and full scale. As the number of measured surfaces are quite large and will be increased over time, a filter for displaying surfaces along with additional information about the surfaces (such as roughness height, type and pictures) are available. Finally, based on the delivered power of the vessel, the fuel consumption increase for each selected surface is presented in absolute numbers and in graphical form. Shipowners and operators who complete fouling measurements for the database are helping expand the dataset of skin friction measurements on rough surfaces for the maritime industry.
Fuel consumption comparisons
The database also has a more practical purpose: to create an easy-to-use interactive tool that can be used to better estimate fuel consumption due to hull roughness.
This is designed to offer vessel management a tool to allow a better cost/benefit analysis of when and how to improve a vessel’s surface condition. Ultimately, the data in the database could help contribute to ship operator decisions around the frequency and intensity of scheduled surface treatment of vessels, which could help to reduce fuel costs, as well as reducing overall emissions of greenhouse gases from the maritime sector.
Model tests: A flat plate was used to test various rough surfaces in SSPA’s Towing Tank. By applying coatings, growing bio fouling in the ocean and creating simulated surfaces of flaking paint and cleaned surfaces (a total of 16 rough surfaces) and towing the plate through SSPA’s Towing Tank measuring the resistance, the skin friction for each surface was measured. All rough surfaces tested were chosen to reflect surfaces normally seen on commercial vessels.
Along with measurements from other laboratories, these results are used and presented in the database interface as input to the extrapolation and the fuel consumption increase estimate also included in the database interface. The extrapolation method consists of Granville similarity for extrapolation in the length dimension and roughness function extrapolation in the speed dimension according to the Towing Tank Conference (ITTC) procedure.
Verification
The results of the database and the evaluation tool have been compared with sea trial data and CFD computations.
Sea Trials
The table below lists four cases from real ships, where the power was measured on board either at sea trials or during operation before and after docking. The power difference between before and after docking and a brief description of the hull conditions are summarised in the table below. This detailed data is rarely published and the impact of certain surface conditions on the fuel consumption is in general very low.
|
|
|
Data from real ships |
||||
|
Case |
Condition 1 |
Condition 2 |
Data from |
Speed (kn) |
Measured power difference between condition 1 and 2 |
|
|
1 |
LNG |
New vessel, just docked and cleaned |
2 months of operation. No hard fouling, slime of most of the hull |
Speed trials |
19 |
9% |
|
2 |
Tanker |
New vessel, just docked and cleaned |
Key side 2 months. Barnacles, ~10mm high |
Speed trials |
14 |
~50% |
|
3 |
RoPax |
2-year docking. Full blast and new paint |
2-year docking. Old paint was cleaned and re-painted |
Operation data |
16 |
5% |
|
5 |
RoRo |
Docking. Full blast + self-polishing paint. |
Docking. Spot blast + self-polishing paint |
Operation data |
20 |
5-10% |
Based on pictures and description of surface condition, the database was used to estimate fuel consumption difference between before and after docking. As can be seen the estimates are fairly close to the actual measured difference. No hull roughness height measurements were available for any of the vessels described below, which would probably increase the accuracy.
Skin Friction database – Car carrier
The table below includes modelled power differences for hull conditions for a car carrier, based on the Skin Friction database. The outcome is shown in the table below. For example, it is concluded that:
· The fuel consumption increases by ~65 % if the hull surface is covered with barnacles.
· Light biofouling can give a fuel increase of 8%.
· The punishment for bad paint application work that increases the roughness from 65my to 130 my is 5% in fuel consumption.
· A surface with barnacles that is mechanically cleaned with some remains of barnacles result in 5% higher fuel consumption than a surface that is high pressure cleaned.
|
Surface condition |
Power increase (%) compared to new antifouling, 65my |
|
Antifouling, 65my |
0 |
|
Antifouling, 110my |
3 |
|
Antifouling, 130my |
5 |
|
Light clean, barnacles remaining (140my) |
9 |
|
High pressure cleaned (110my) |
4 |
|
Light biofouling |
8 |
|
Barnacles, less dense |
42 |
|
Barnacles, dense |
63 |
Impact of paint condition on fuel consumption
The database also included several cases of the impact of paint condition/damage on fuel consumption. The table below shows the power increase for the example ship. The test case below revealed higher fuel consumption if the edges are not feathered (i.e. the edges between old and new layers smoothed with a grinder). For the flakes it should be mentioned that it is artificial flakes with significantly lower flake edge length/area that normally seen on a coated maritime surface
|
Surface condition |
Power increase (%) compared to new antifouling, 65my |
|
Flakes, 1mm, painted over |
0.4 |
|
Flakes 2mm, painted over |
0.3 |
|
Flakes, 3mm, 2.2% feathered |
0.8 |
|
Flakes, 3mm, 4.5% feathered |
1.2 |
|
Flakes, 3mm, 4.5% |
4.0 |
Ultimately, it is the hope that the database can contribute to decisions leading to generally better surface treatment of vessels, reducing costs and emissions of greenhouse gases from the maritime sector. The extrapolation and fuel estimation tool are not intended to replace the more precise estimates that can be obtained from Computational Fluid Dynamics (CFD) simulations. But the results should be broadly reliable enough for cost/benefit estimation purposes, as comparison of the results of the Skin Friction Database and CFD simulations suggest a strong correlation.
Related Articles
 ALTERNATIVE FUELS & LUBRICANTS
 GENERAL NEWS
 GENERAL NEWS