


Solutions already exist for 2050 emissions ambition, study
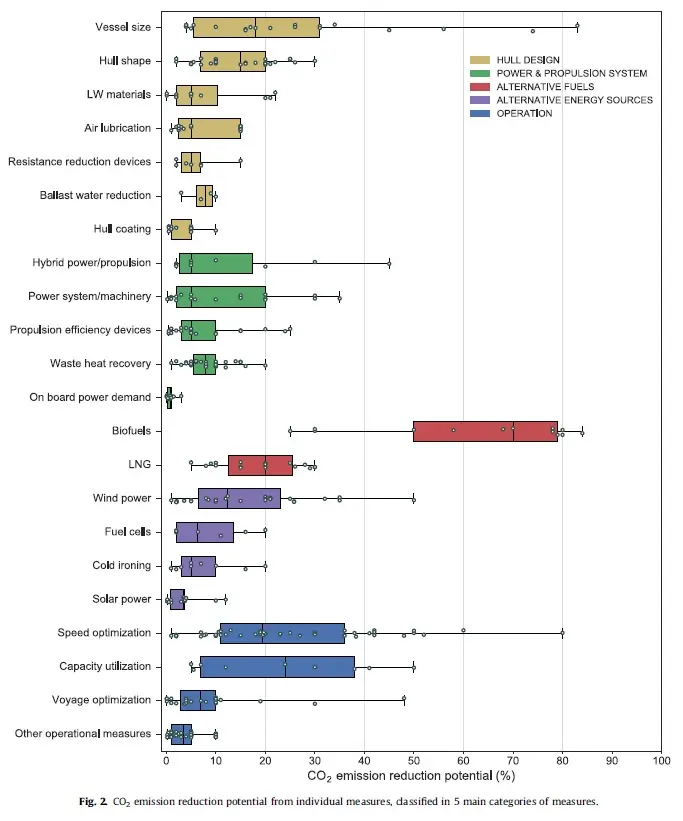
The review looked at studies of several technologies, broadly divisible into hull design, power and propulsion, alternative fuels, alternative energy sources and operational categories. The CO2 emissions forecast in the final year of each study and the emission reduction potential ascertained in that year were considered. Median reduction rates were 35%, 39% and 73% for the final years 2020, 2030, and 2050 respectively. The study also noted that the highest range of reduction potential, 58-77%, was found in 2050 estimates – reflecting the time taken to adopt measures.
The review concluded that it would be feasible to achieve a 75% reduction in fleet emissions using a viable combination of the technologies studied. An example combination includes optimised vessel size and hull shape, reduced ballast water, hull coatings, hybrid power and propulsion, propulsion efficiency devices, speed optimisation and weather routing. Using this arrangement – and assuming independence between the measures – a theoretical 77% cut in CO2 emissions was achieved.
The authors noted that the shipping sector is facing pressure to significantly reduce its GHG emissions in line with international ambitions. But an anticipated tripling of world trade between 2012 and 2050 will see the industry’s emissions grow by 150-250% in that time, if no further emissions reduction steps are taken.
They conclude: “Emissions can be reduced by more than 75%, based on current technologies and by 2050, through a combination of measures if policies and regulations are focused on achieving these reductions. In terms of emissions per freight unit transported, it is possible to reduce emissions by a factor of 4–6.”
The review, written by researchers from the Norwegian University of Science and Technology (NTNU) and Marintek, was originally published in the journal Transportation Research and can be downloaded here.
Related Articles
 ALTERNATIVE FUELS & LUBRICANTS
 GENERAL NEWS
 GENERAL NEWS