


IMO report estimates emissions from biofouling
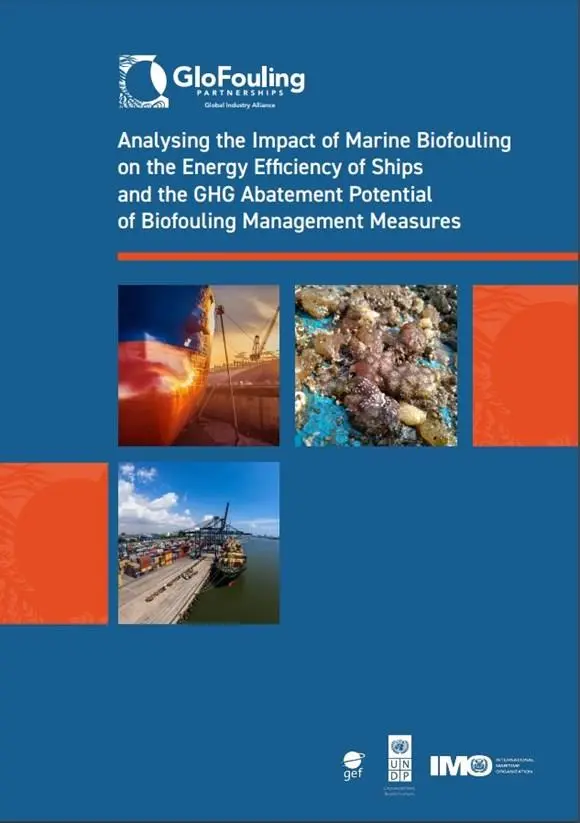
The report – Analysing the Impact of Marine Biofouling on the Energy Efficiency of Ships and the GHG Abatement Potential of Biofouling Management Measures highlights that a layer of slime as thin as 0.5 mm covering up to 50% of a hull surface could trigger an increase of GHG emissions in the range of 25 to 30% depending on ship characteristics, its speed and other prevailing conditions. These percentages can be much higher for more severe biofouling conditions, depending on the type of ships and other parameters.
For more severe biofouling conditions, such as a light layer of small calcareous growth (barnacles or tubeworms), an average-length container ship could see an increase in GHG emissions of up to 60%, dependent on ship characteristics and speed. For the medium calcareous fouling surfaces, the increase in GHG emissions could be as high as 90%.
In addition to analysing the impact of biofouling on ship efficiency and how current industry practices for biofouling management impact ship efficiency, the study presents results from seven scenarios in relation to a clean reference of a bulk carrier, between dry-docking periods. The results demonstrate the magnitude of fuel, CO2 and cost savings that can be achieved by keeping this ship as clean as possible from biofouling.
A survey of 249 ships in Northern Europe conducted by the Safinah Group in 2020 found that 40% of ships had more than 20% hard macrofouling on their flat bottoms and approximately 10% of sampled ships had more than 40% of their underwater areas covered by hard macrofouling
The IMO says that biofouling management is an important contributor to the overall operational efficiency of ships and should be considered by shipowners to achieve IMO’s Carbon Intensity Indicator (CII) rating indicator that measures vessel carbon intensity over time.
The report is available here.
Related Articles
 ALTERNATIVE FUELS & LUBRICANTS
 GENERAL NEWS
 GENERAL NEWS