

Efficiency improvements to main engine auxiliary systems
The options cover power efficiency improvements of electric auxiliary equipment, for example pumps, fans, and other equipment serving the main engine, but also efficiency improvements related directly to the main engine specific fuel oil consumption. This technical paper describes each of the different relevant main engine auxiliary systems and the options available for efficiency improvements. Different solutions are mentioned for each system, some of these can be combined and the savings potential added up, while others will exclude each other depending on the selected option.
To illustrate the potential savings obtained by installing the suggested efficiency improvements, a specific engine type has been chosen and an annual operating profile has been defined. Some of the efficiency improvements may also have a beneficial impact on the common auxiliary system for other consumers. This is not accounted for in the description and calculation of the savings potential.
Basic data
The identified savings potential is illustrated by an annual heavy fuel oil (HFO) saving based on a specific main engine and a specific annual operating profile. The annual HFO savings potential is not converted to operational expenditure (opex) savings as fuel oil prices differ according to bunker oil quality, location and the world financial situation. Furthermore, the capital expenditure (capex) for each suggested efficiency improvement has not been estimated, since it will differ for each contractor, supplier or shipyard.
The business case based on opex savings and the additional capex for each individual efficiency improvement must be carefully investigated by the vessel operator to define if the investment has a beneficial payback time and positive net present value based on the operating profile, interest rates, type and size of vessel, and other relevant factors for the specific vessel.
Main engine
To estimate the specific savings for the suggested efficiency improvements, the engine type MAN B&W 8G95ME-C9.5 TII has been chosen. The specific fuel oil consumption (SFOC) versus engine load for this engine is depicted in Fig. 1. This engine type is installed in, for example, large container vessels operating worldwide.
Annual operating profile
An annual operating profile has been estimated to calculate the main engine (ME) annual fuel oil consumption. This profile will of course differ according to the actual route of the vessel, but it is needed to get an idea of the number of operating hours at different ME loads and ambient seawater temperatures, see Fig. 2. Port stays are listed as 0% engine load.
Annual main engine FOC
Based on the SFOC for the 8G95ME-C9.5 Tier II engine combined with the annual operating hours, it is possible to get the SFOC for each specific condition via MAN Diesel & Turbo’s CEAS (computerised engine application system) application. The adjusted SFOC value is multiplied by the specific engine load and operating hours to get the heavy fuel oil consumption, which is shown in Table 1.
Summary
Overall, when choosing the most beneficial solution for each system and upon adding all the cumulative savings, it is possible to arrive at a good estimate of the total savings obtainable for the auxiliary system for an MAN B&W 8G95ME-C9.5
Tier II.
The following options have been chosen:
- Main engine direct air intake;
- Optimised cooling water system;
- Operate the seawater pump and the central cooling water pump with VFDs (variable frequency drives);
- Use the optimised system pressure loss: Seawater pumping head: 1.6 bar (baseline 2 bar); central water pumping head: 2.0 bar (baseline 2.5 bar); jacket-cooling-water pumping head: 2.7 bar (baseline 3.0 bar);
- Use a mechanical pumping efficiency EFFm = 80% instead of the baseline efficiency 75%;
- Use the electric motor efficiency class IE3 instead of baseline class IE1;
- VFD-operated fuel-oil supply pump and circulation pump;
- Optimised lubricating oil main system.
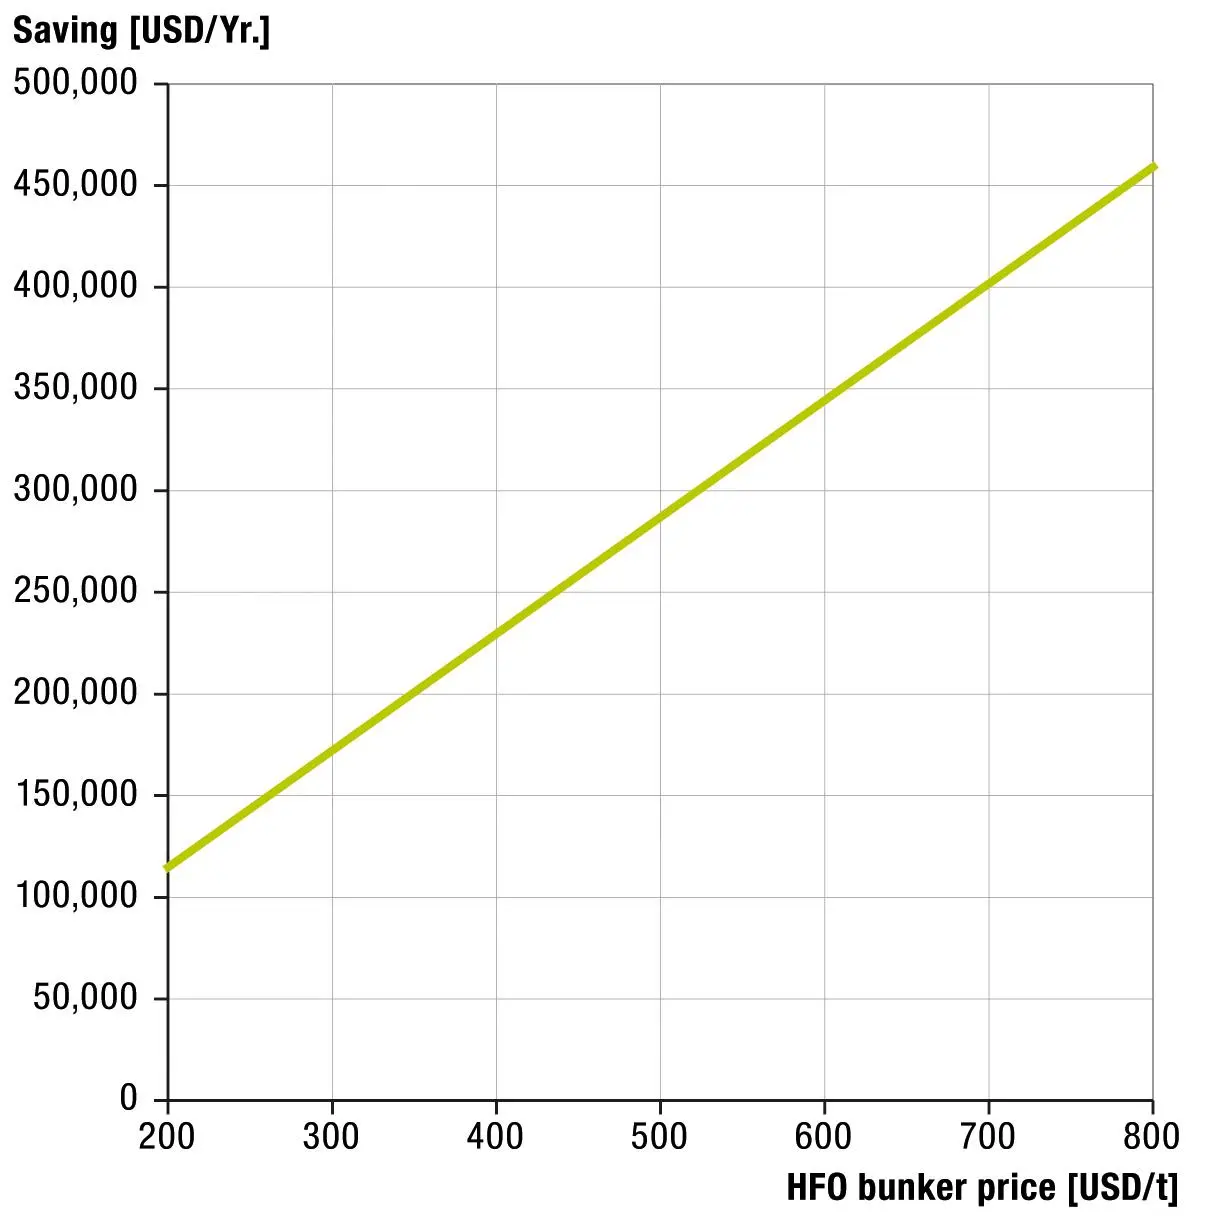
The overall savings are shown for each system in Table 2. The opex savings are shown in Fig. 3 as a function of HFO bunker price.
This article is a heavily abridged version of the original paper, which is freely available from MAN Diesel & Turbo upon request.
|
Table 1: Annual HFO consumption |
||||||||||||||
|
Ambient conditions |
Engine load |
|||||||||||||
|
Ambient SW temp. |
Cooling water temp. |
Ambient air temp. |
0% |
1-10% |
11-20% |
21-30% |
31-40% |
41-50% |
51-60% |
61-70% |
71-80% |
81-90% |
91-100% |
|
|
[°C] |
[°C] |
[°C] |
0 |
10% |
15% |
25% |
35% |
45% |
55% |
65% |
75% |
85% |
95% |
|
|
>30 |
32 |
36 |
39 |
0 |
55 |
237 |
378 |
867 |
549 |
663 |
777 |
537 |
82 |
0 |
|
26-30 |
28 |
32 |
35 |
0 |
165 |
631 |
691 |
1,037 |
1,313 |
1,453 |
1,394 |
1,785 |
203 |
0 |
|
22-26 |
24 |
28 |
31 |
0 |
137 |
472 |
501 |
689 |
873 |
1,054 |
927 |
1,424 |
203 |
0 |
|
18-22 |
20 |
24 |
27 |
0 |
137 |
314 |
499 |
601 |
652 |
788 |
924 |
1,419 |
202 |
0 |
|
14-18 |
16 |
20 |
23 |
0 |
54 |
117 |
124 |
171 |
434 |
523 |
614 |
530 |
202 |
0 |
|
8-14 |
11 |
15 |
18 |
0 |
27 |
78 |
124 |
85 |
216 |
391 |
458 |
528 |
201 |
0 |
|
<8 |
6 |
10 |
13 |
0 |
27 |
39 |
62 |
85 |
108 |
260 |
304 |
351 |
0 |
0 |
|
Annual HFO consumption: 30,746 t/yr., ref. LCV: 40,200 kJ/kg |
||||||||||||||
|
Table 2: Total savings thanks to reduction in required pumping energy |
||||
|
Basic |
Optimised sys. [t/yr.] |
Savings |
||
|
Main engine direct air intake |
215 |
0 |
215 |
|
|
Cooling water |
417 |
188 |
299 |
|
|
Fuel oil system |
27 |
15 |
12 |
|
|
LO system |
267 |
219 |
48 |
|
|
Total annual savings |
996 |
422 |
574 |
|
Related Articles
 PROPULSION
 GENERAL NEWS
 GENERAL NEWS