

Paris and Tokyo MOUs say lifeboat safety too lax

The Paris MOU (27 members) carried out 5,749 Port State Control (PSC) inspections while the Tokyo MOU (18 members) carried out 6,128 PSC inspections, which included 4,834 CIC inspections.
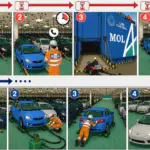
The Paris MOU inspections keyed into vital points of SOLAS Chapter III, ISM and the LSA Code requirements. Preliminary results showed one out of every five inspections had CIC-related deficiencies. During the 3 month period, 246 ships were detained with 30 percent being CIC related. This translated into 80 cases of lifeboat launchings appliances with serious deficiencies, which were bad enough to detain the vessels.
During the Paris MOU inspection campaign 2,136 CIC-related deficiencies were found and one out of every six launching drills was done improperly. Of the total 67 flags inspected, 32 flags had one or more CIC related detentions.
Most CIC inspections took place on general dry cargo ships (38%), followed by Ro-Ro ships (15%) and bulkers (13%) Bulkers had the highest detentions (3%) followed by dry cargo ships (2%) and refrigerated cargo ships (1.2%)
Tokyo’s MOU inspections indicated that 18.2 percent of the 6,128 inspections had CIC-related deficiencies and during the three month inspection period a total of 324 ships were detained with 123 having lifeboat launching appliance CIC deficiencies.
Moreover, the Tokyo MOU found that 12 percent of the conducted drills were not performed satisfactory, which indicated a high level of inadequate training. Additionally, procedures or instructions and identification of hazards associated with launching and recovery of lifeboats were found unsatisfactory on 15 percent of vessels inspected. Of the 80 flags subjected to CIC inspections, a total of 30 flags had one or more CIC related detentions.
Most CIC inspections took place on bulk carriers (29%), followed by general cargo/multi-purpose ships (27%) and container ships (16%). On vessel types subject to 10 or more inspections, Ro-Ro passenger ships have the highest detention rate (12.5%, 16 inspections) followed by passenger ships (8.8%, 34 inspections), bulk carriers (3.2%, 1421 inspections), gas carriers (2.9%, 105 inspections), and general dry cargo/multi-purpose ships (2.7%, 1303 inspections).
Related Articles
 ALTERNATIVE FUELS & LUBRICANTS
 GENERAL NEWS
 GENERAL NEWS